Overview to the VisualPQL GUI Debugger
A debugger provides a means of following the execution path through the program statements. Execution can be suspended at any point to examine the values of program variables. In this way the developer can determine where an incorrect branch is taken or if a variable has the expected value.
The VisualPQL debugger is itself a VisualPQL program that uses particular debug functions to interact with the executing system. If you wanted to, you could use these functions to develop a different interface to the debugger but you do not need to use these functions simply to debug your own programs. To avoid confusion, these functions are not documented here, please contact SIR support for details, if you need them.
Using the debugger requires additional memory beyond that needed by the program. As a VisualPQL program is compiled, source commands are converted into operating codes that are the executable program and these are held in the command stack. When the DEBUG option is specified on the RETRIEVAL, PROGRAM or SUBROUTINE commands, the compiler keeps the text of each command along with the corresponding operating code in the stack (which is why the debugger requires much more memory). Each command in the stack is assigned a command number that is used for internal reference and is used on several commands that display the contents of the stack. These numbers are not editor line numbers or the line numbers in a source code listing.
The following discusses the VisualPQL debugger and the options that are available.
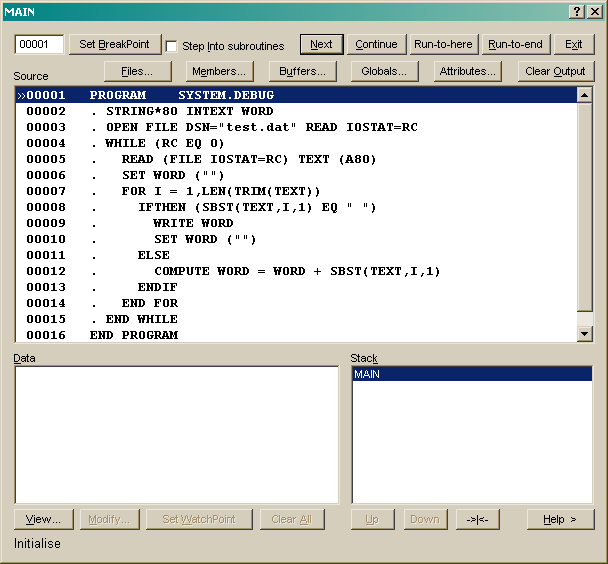
To start the debugger, first compile a program with the DEBUG keyword then select Debug... from the Program menu. Select the compiled object (SYSTEM.DEBUG:O is the default) from the member list.

The VisualPQL Debugger
Source
The currently selected line number is displayed in the top left. This is not necessarily the line that is about to be executed but it is the line that is effected by the Set.BreakPoint and Run-to-here buttons.
The Set BreakPoint button sets or clear a breakpoint on the selected line. A breakpoint is a command where execution stops before that command is executed.
The Step Into Subroutines box if checked and subroutines are compiled with debug, means that the source of the subroutines are displayed when they are executed.
Press Next to execute next command and moves the selected line to the next executable line.
Press Continue to run until a breakpoint or watchpoint is hit or the program ends.
Run-to-here executes all lines until the selected line is reached.
Run-to-end executes the program ignoring all breakpoints and watchpoints.
Exit stops debugging, stops the program execution and closes the debugger.
The Files, Members and Buffers buttons let you open, edit files members and buffers.
The Globals and Attributes buttons let you view and modify global variables and file attributes.
Clear Output clears the main window output area.
The Program source code lines are displayed in the large listing area. Note that the line that is about to be executed is marked with a » character and the
selected line is highlighted.
Data
The Bottom left of the debugger deals with program variables. Selected variables and their
values are displayed in the list. By default, no variables are selected for display.
Press View to select variables of interest or to change the order that they are displayed. The most recently selected are displayed first.
Press Modify to change the value of a variable.
Press Set Watchpoint to set a watchpoint on or off on the selected variable. A watchpoint means that execution stops on the command after the command that changes the value in that variable. An active watchpoint is indicated with a ¤
Press Clear All to remove all watchpoints.
Double click on a variable to modify its value.
When a variable is selected from the list, its value is displayed at the bottom of the screen. If it is a string variable then blanks are shown with a dot (·).
Stack
The bottom right of the debugger shows the program stack. This indicates the levels of called subroutines that have been traversed to get to the current point and lets you view and navigate through levels of subroutine source. The routine currently being executed is shown at the top of the list.
Press Up to move to the source that called the currently displayed source.
Press Down to return one level to the source of the called subroutine (after pressing up).
Press ->|<- to return to the subroutine source and line about to be executed.
You can double click on a routine to view its source.
How to debug a program
A small program could be debugged by viewing all variables and pressing Next through each line
of the program until the problem is detected. View the values of variables and expressions to
determine why the program is behaving unexpectedly.
In a larger program, you probably need to set breakpoints or watchpoints to stop execution and return to the
debugger when a particular line is about to be executed or when the value of a given variable is changed.
After setting a breakpoint on a source line or a watchpoint on a variable, press continue to execute
the program. The following example is a small program that is easily debugged but is worked through
in detail to show a debugging process.
This example program is meant to extract first name, last name and middle initial from a string containing
a full name. The problem is that last name is not being calculated properly.
SUBROUTINE FMLNAME (NAME) RETURNING (FNAME,MINIT,LNAME) REPLACE  NODATABASE DEBUG DYNAMIC
. STRING*50 NAME
. STRING FNAME MINIT LNAME
. INTEGER FSPACE LSPACE
. SET FNAME MINIT LNAME ("")
. COMPUTE FSPACE = ABS(SRST(NAME," "))
. COMPUTE LSPACE = LEN(NAME) + 1 - ABS(SRST(REVERSE(NAME)," "))
. COMPUTE FNAME = SBST(NAME,1,FSPACE-1)
. COMPUTE LNAME = SBST(NAME,LSPACE+1,LEN(NAME)-LSPACE)
. IF (LSPACE NE FSPACE) COMPUTE MINIT = SBST(NAME,FSPACE+1,1)
END SUBROUTINE

RETRIEVAL DEBUG
. STRING FNAME MINIT LNAME
. PROCESS CASES
.   PROCESS RECORD 1
.     EXECUTE SUBROUTINE FMLNAME (NAME) RETURNING (FNAME,MINIT,LNAME)
.     WRITE NAME
.     WRITE FNAME " / " MINIT " / " LNAME
.   END RECORD
. END CASE
END RETRIEVAL
Start retrieval execution
John D Jones
John  / D  / *
James A Arblaster
James  / A  / *
Mary Black
Mary  / B  / *
...
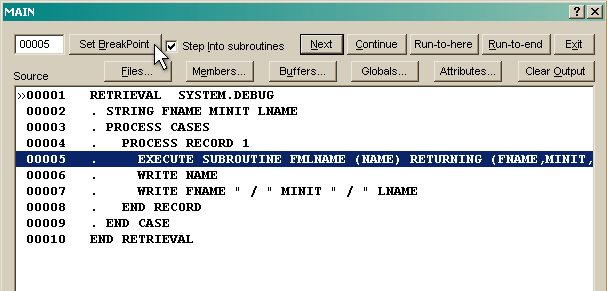
The problem is in extracting components from the variable NAME in record 1 so start by setting a breakpoint near the start of that record block.

Setting a BreakPoint
Then press continue. Execution stops on that line.
Check the step into subroutine box so that you are able to debug the called subroutine and press next. You should now be looking at the subroutine source.
We know the computation of last name (and middle initial) is not working so put a break on
. COMPUTE LNAME = SBST(NAME,LSPACE+1,LEN(NAME)-LSPACE)
In the Data section Press View, select all variables and press OK. Looking at the data section we see NAME is John D Jones, LSPACE (the last occurrence of blank in the name string) is 25 where we were expecting 7.
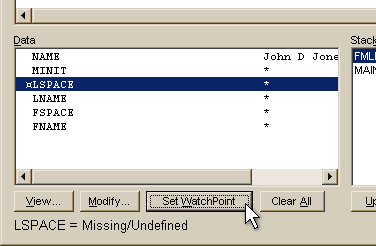
At this point we could work out the problem but for sake of the example, put a watchpoint on LSPACE so we can find the next time it is modified and clear the breakpoint on LNAME (select it and press set breakpoint).

Setting a WatchPoint
Press continue and execution stops at the breakpoint at the start of the record 1 block in the main routine.
Press continue again and execution stops after the line that has set the value of LSPACE:
. COMPUTE LSPACE = LEN(NAME) + 1 - ABS(SRST(REVERSE(NAME)," "))
Select NAME from the data list and you see its value displayed at the bottom of the screen padded with blanks to 25 - so the last blank is at 25.
Repeat the process but press next rather than continue when executing the subroutine. Use the modify button in the data section to remove trailing blanks from the name and step through the computes to see that the program is working correctly.
So the fix is to remove the trailing blanks from NAME when calculating the positions of the blanks.
...
. COMPUTE NAME = TRIM(NAME)
. COMPUTE FSPACE = ABS(SRST(NAME," "))
. COMPUTE LSPACE = LEN(NAME) + 1 - ABS(SRST(REVERSE(NAME)," "))
...
Exit the debugger, make the program change and run it again.
 VisualPQL


 VisualPQL


